Module: Main Dashboard Visualisations
Purpose: The main dashboard for audit desk has several key visualisations and tracking tools that help users better track and manage their outstanding actions.
To Access: Main Menu > Audit Desk
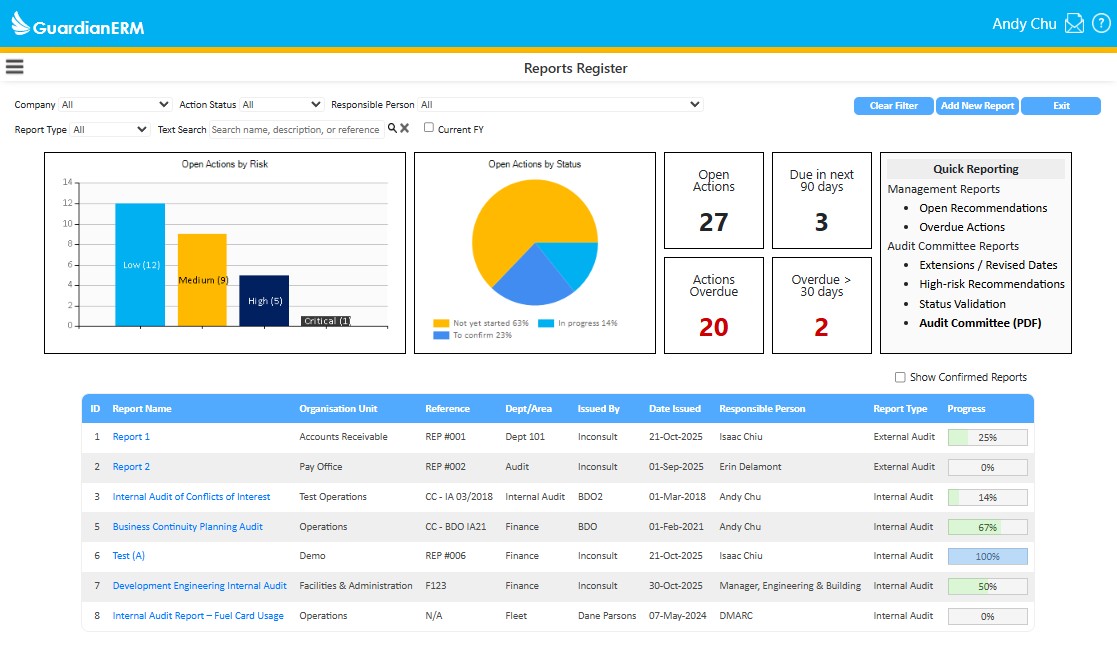
Audit desk was purpose built to support users better track and manage their outstanding actions. There are a number of data visualisations and interactive features to enable this:
Graphs and other visualisations have been incorporated into Auditdesk to give users a quick glance view of what items need particular attention.
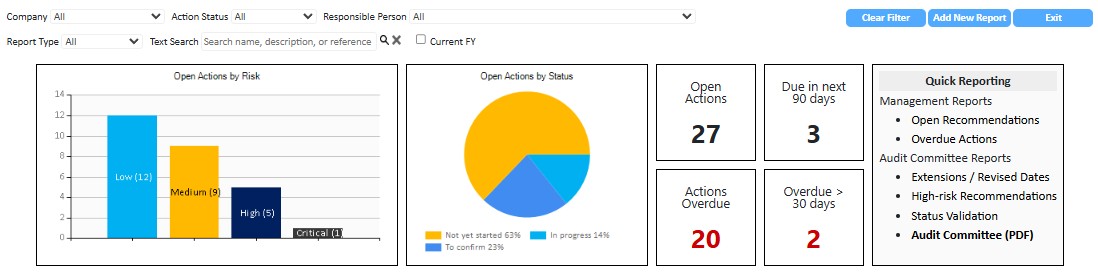
The bar graph on the far left shows all Open Actions by Risk. This graph collects all Risk data at an action level and displays the consolidated view of outstanding actions.
The pie chart shows the status of all outstanding actions (at an action level). To quickly view items that need to be confirmed – generate a listing by clicking the “Status Validation” report in Quick reporting
To quickly navigate to a specific list of open actions, use the filter section above the graphs. The available filter parameters are:
| Tile | Description |
|---|---|
| Open Actions |
Shows the total number of actions currently open across all reports. Quick Report: "Open Recommendations" |
| Due in the next 90 days | Indicates how many open actions are approaching their due date in the next 3mths |
| Actions Overdue |
Displays the total number of actions past their due date. This only includes actions
that have either the status “Not yet started” or “In Progress”. Quick Report: "Overdue actions" |
| Overdue > 30 Days | Shows a subset of overdue actions that are more than 30 days late. These are items that need urgent attention. |