To be able to create or modify user reports, you need a special authority called Report Design. Check with your GuardianERM.net system administrator if you have no access to the Design Reports function.
You can create reports and customise it to your specific needs using this function. Report definitions are saved and can be run any time in the future. However, be aware that this function is quite complex and the processing logic may not be the same as what you expect and you may end up with a report showing you incorrect data.
In general, do not be over-enthusiastic when creating a report, especially in the beginning and always verify the designed report using data on the online screens and the Guardian Reports where available. Make your reports more manageable by including less data fields with fewer filter conditions to satisfy specific needs.
The GuardianERM security sanctions also apply to the reports. For example, if you have created a public report including an organisation unit where a user running the report has no read access, the user running the report will not see data for that organisation unit even if it was included in the design.
To allow a user to design report, the user's security profile must include the User Report Design authority.
To modify an existing report, select the report you want to modify from the dropdown list. The modification procedures are the same as the Create a User Report.
To create a User Report
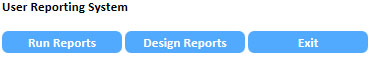
Click the Design Report button on the GuardianERM.net User Reporting System screen:
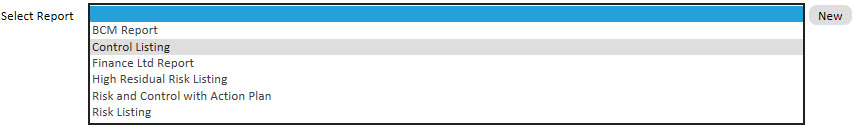
Select the report category by clicking the appropriate button:
If you have multiple companies set up in your Organisation Units Library, select the company for the report from the Company dropdown list at the top of the page.
![]()
Then click the New button:
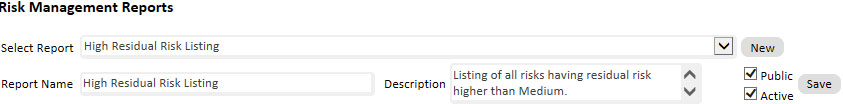
Enter a name and an optional description for the report. Make sure the Active box is ticked and if you want all users to be able to run this report, tick the Public box. If the box is blank, only you, the creator of the report can run the report. Click the Save button to save the report heading.
Note: If a report is made inactive (the Active box is not ticked), it will not be accessible any more.
From the Fields to Include in Report panel that appears, tick the data fields you want to include on the report:
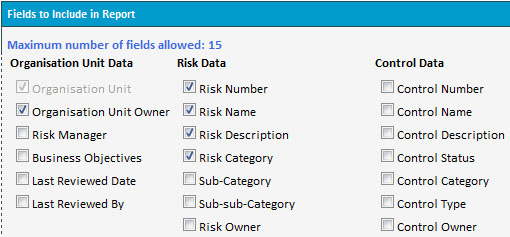
There is a limit of 15 data fields you can include in one report.
Once you have selected all the fields you want, click the Next button at the bottom to configure the appearance sequence of the selected data fields:
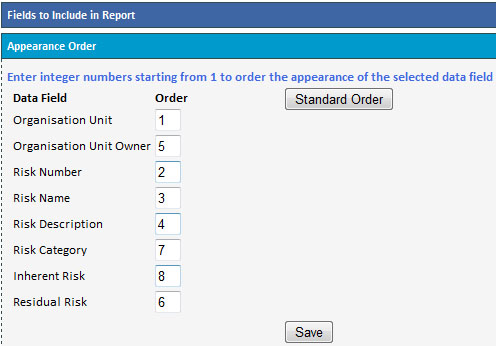
Enter integer numbers in the Order fields to denote which field comes before or after another field. In the above example, the report will show the data columns in this order:
If you duplicate a number or have a number missing in the sequence, an error message will appear when you click Save prompting you to correct the error.
You can click the Standard Order button to re-order the fields to the default sequence.
Click the Save button to continue onto configuring the report filters.
Note: If you are modifying an existing report and have changed the data field selections, the appearance order will be out of sequence. Either click the Standard Order to arrange the data fields using the default order or enter the sequence numbers manually.
Configuring the report filters:
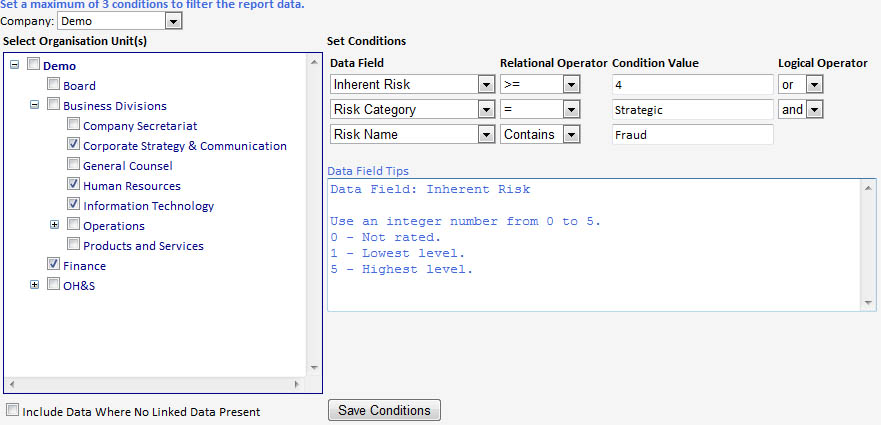
When a data field selection is changed, the Data Field Tips box will show, where applicable, the type of data that is stored for that data field.
Note: The logical operator is critical in determining what data is being selected for the report. Incorrect use will produce erroneous data. In the above example, only the risks that have a category of Strategic and a residual risk of 4 or above will be selected. If you use Or instead of And, then all risks with Strategic category regardless of the residual risk level and all risks with a residual risk level 4 or above regardless of what category they belong to will be selected.
If you want to list all the data selected in a data field category whether there is data in data fields in categories to the right of the first selected category, tick the Include Data Where No Linked Data Present box. In the above example, if the box is ticked, then all organisation units selected will be listed on the report whether they have risks with residual risk level 4 or above. It is best to experiment with this to get the report you desired.
Note: Depending on the design of the report, ticking the Include Data Where No Linked Data Present box can produce a very large report and the report may take a long time to run.
Note: To remove a filter, clear the Condition Value text box and click Save.
Tip: If the field tips are not helpful enough and you do not know what value to use for the Condition Value field, do not use any filters and take a look at the sample report to see what kind of data is stored for the field.
You can now define the sort order of the rows contained in the report:
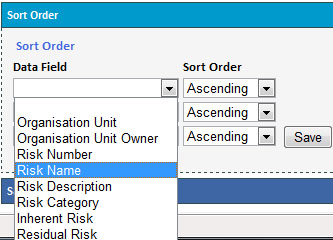
Select the first data field by which to sort the report rows and select either Ascending or Descending order.
Click the Save button when finished and a sample report will be shown:

Click the Save Report Definition button to save the report and now the report is ready to be run.
Note: